TL;DR
Hi, this is Debugger ready to debug JavaScript.
In this blog, we will continue from where we left off Part-1 in this Client-side Encryption Bypass Series.
We will see some cool tips and tricks related to DevTools, which will be helpful to you when trying to break the encryption logic on your own.
TL;DR Quote
Debugger is always your BestFriend.
Introduction
Before I start, I would strongly recommend to go through part-1 if you haven’t already.
In the previous blog, we saw the steps to break the encryption mechanism, but identifcation can sometimes be very complex. The chances to finding the exact method from a huge list of files is not only time consuming but makes the debuging process tedious.

So, Is there any way to make this process easier?
Well, not completely. But yes, there are some magic tricks which can helps make the process comparatively easier and ensure smooth debugging process.
Let’s get into it one by one:
1. debug():
It is a built-in method of devtools which helps you to debug the method directly without inserting any debug points. To use this method all you require is the name of method, where you wish to stop the execution process. Rest will be handled by this method. Devtool will take you to the method directly and let you observe the current values of all the parameters and objects in the scope section.
We can use this method to stop,continue,step in and step over process to reach the specific debug location/value.
Steps to use this method:
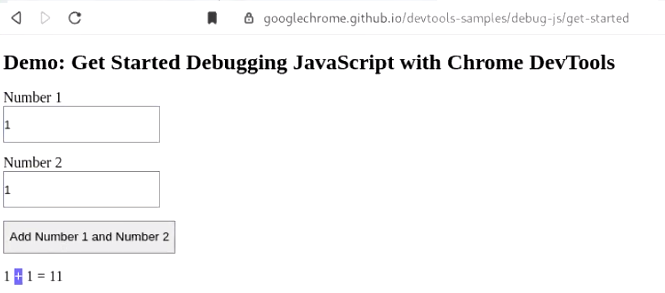
For practical purpose, we can take an example of this website: https://googlechrome.github.io/devtools-samples/debug-js/get-started
a.) Navigate to “https://googlechrome.github.io/devtools-samples/debug-js/get-started” and observe the application behaviour.
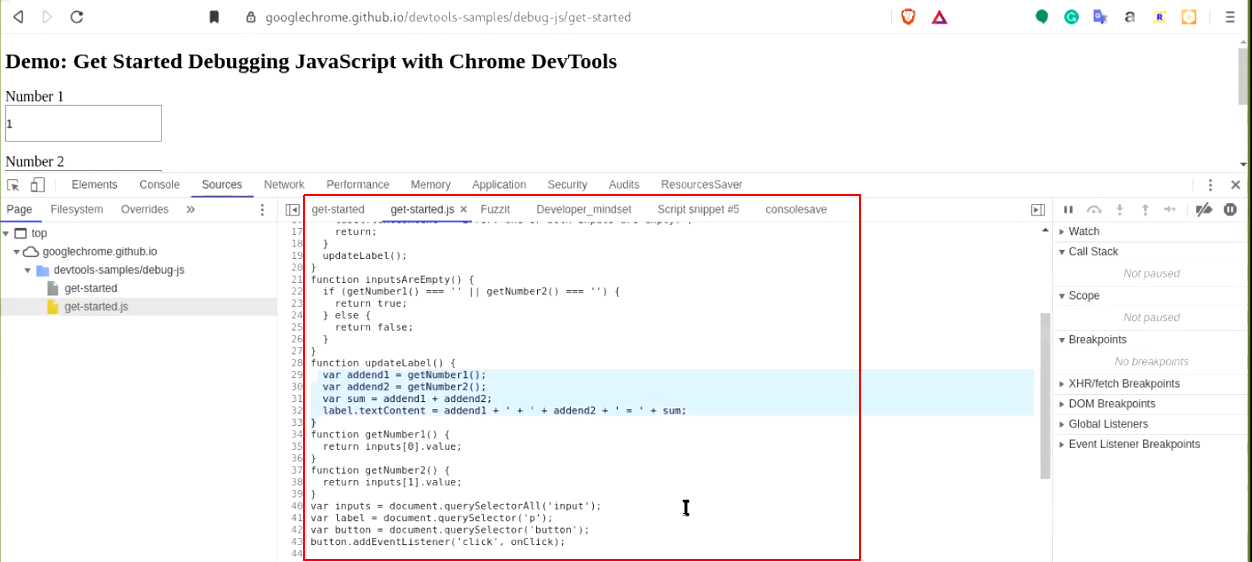
b.) Open the inspect element or devtool and navigate to “Source” tab. Observe the javascript file and method responsible for encryption.
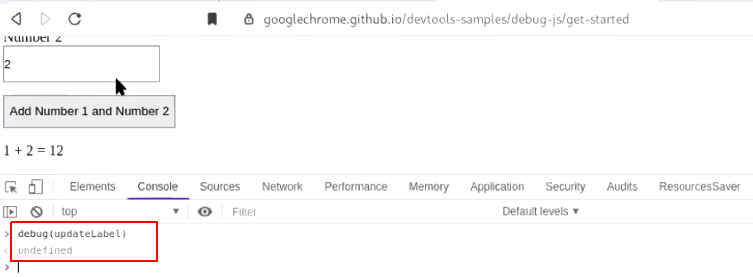
c.) Navigate to “console” section in devtool and run debug(method_name). Observe the output in console.
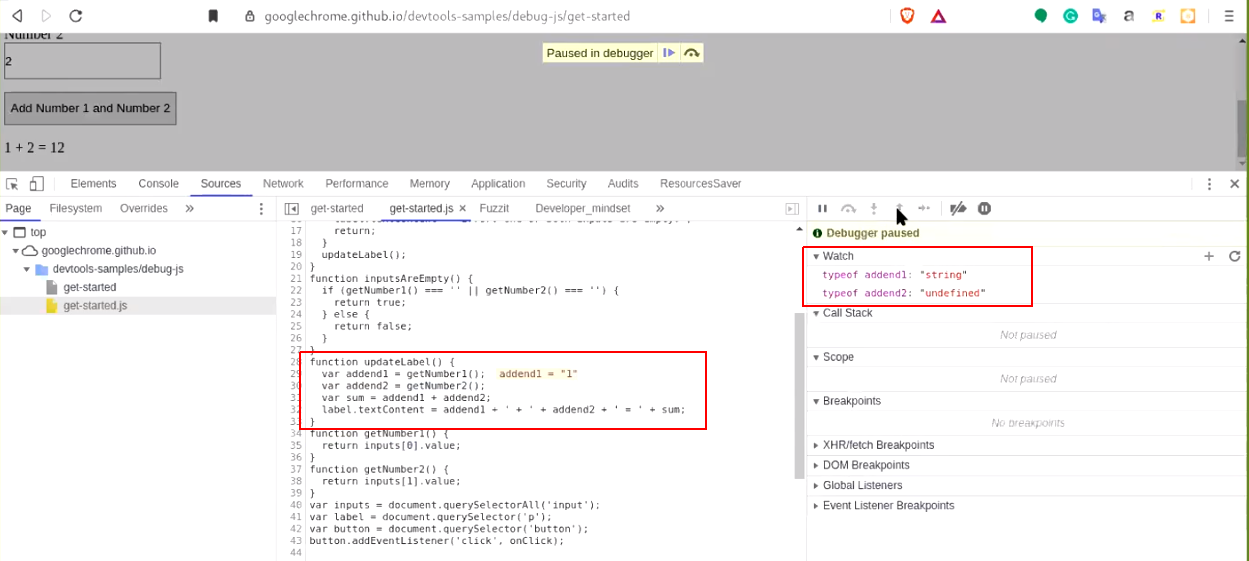
d.) Now, when you “click on the add number button again” the updateLabel gets executed. Evoking the debug point results the execution to stop at line number 29. Observe the variable type “string”.
Note: To stop debugging the method, run - undebug(method_name) in console.
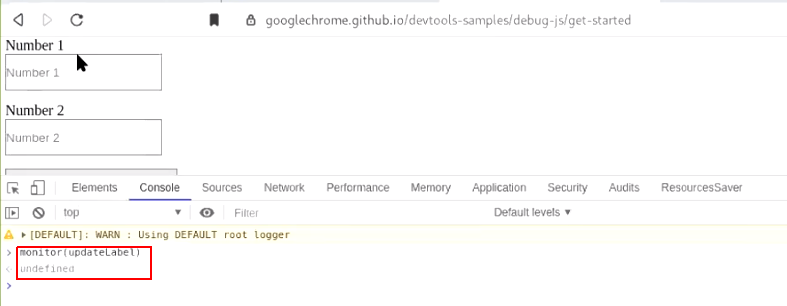
2. monitor():
It is another built-in method of devtools which helps you to monitor the method directly without having to put any debug points. To use this method, all you need is name of the method. Rest is handled by monitor(), and it will give you a notification in console that the method is executed.
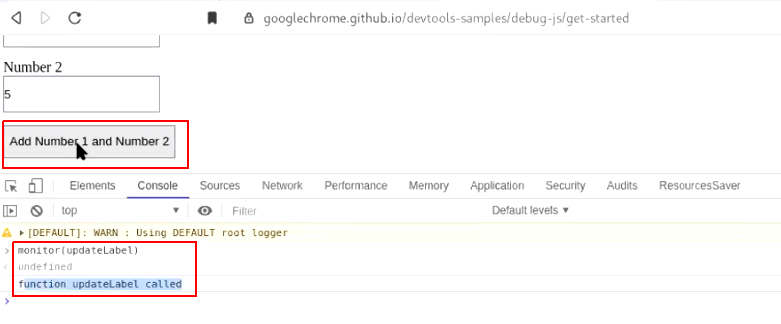
We can use this method to monitor which method is responsible for encryption among multiple encryption logics implemented in the application. This will help reduce the time to go through each and every method. Clicking on submit button would help monitor whichever method gets called out first.
Steps to use this method:
For practical purpose, we can take an example of this website: https://googlechrome.github.io/devtools-samples/debug-js/get-started
a.) Navigate to “https://googlechrome.github.io/devtools-samples/debug-js/get-started” and open the devtool console section. Post run monitor(method_name) and Observe the output in console. Keep your eyes on console as you will notifications in console only.
b.) Now when you “click on the add number button again” the updateLabel gets executed and you will be notified in the console.
Note: To stop monitoring the method, run - unmonitor(method_name) in console.
3. snippets:
It is the most useful and cool feature of devtool. You can run your own javascript inside the DOM of current application, i.e. you can replace a method with your own method by writing the snippet of it and executing it.
Using this feature, you can fuzz each and every parameter of the application. Even if they are encrypted, you can use the same encryption logic as that of the developer’s by calling out the method name. Decrypt the parameters, enter your payload and encrypt it again.
Sounds cool, right? Using the developers tool and developer’s logic to break the encryption layer.:))
Steps to use this feature:
For practical purpose, we can take an example of this website: https://googlechrome.github.io/devtools-samples/debug-js/get-started
a.) Navigate to “https://googlechrome.github.io/devtools-samples/debug-js/get-started” and open up the devtool. Access snippet feature from the source tab. Here, observe that we have written our own snippet code.
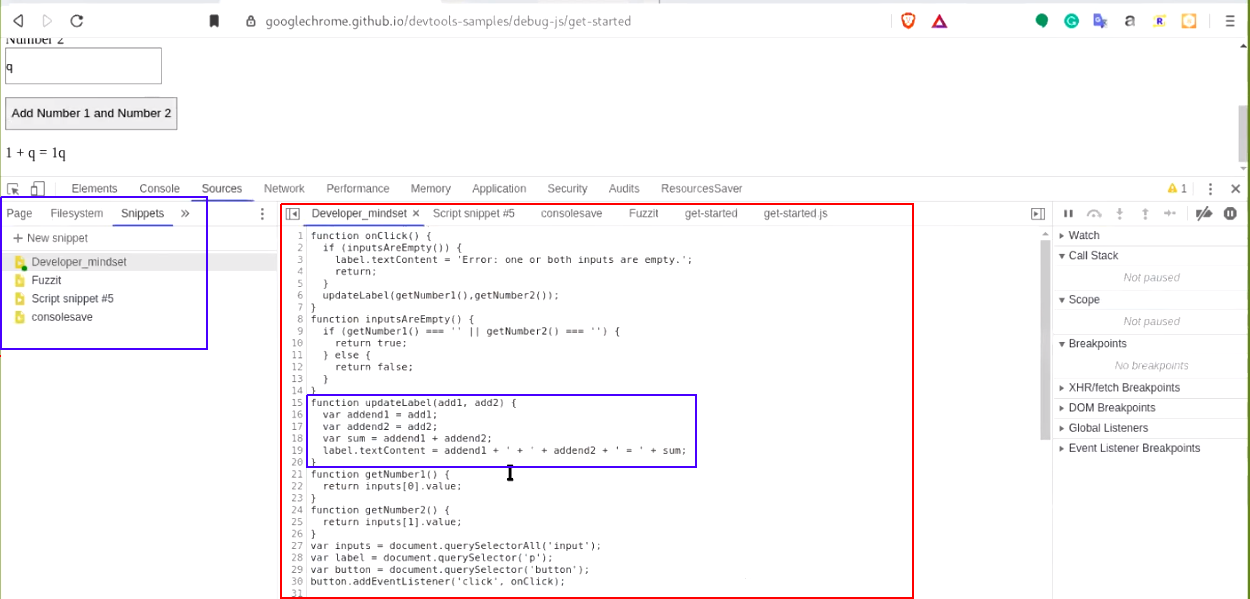
In this code, observe that we have changed the previous updateLabel() method to an argument-based updateLabel(arg1, arg2) method.
b.) To execute the snippet code, click on “Run” at the bottom or use keyboard shortcut keys “Ctrl + Enter”.
Note: This feature is available both in firefox and chrome. However, I have created all my snippets on chrome only as it allows you to modify value of parameters at run time in devtools.
I have prepared a list of devtool-snippets-forhacks, check it out on my github.
4. monitor() + Snippet:
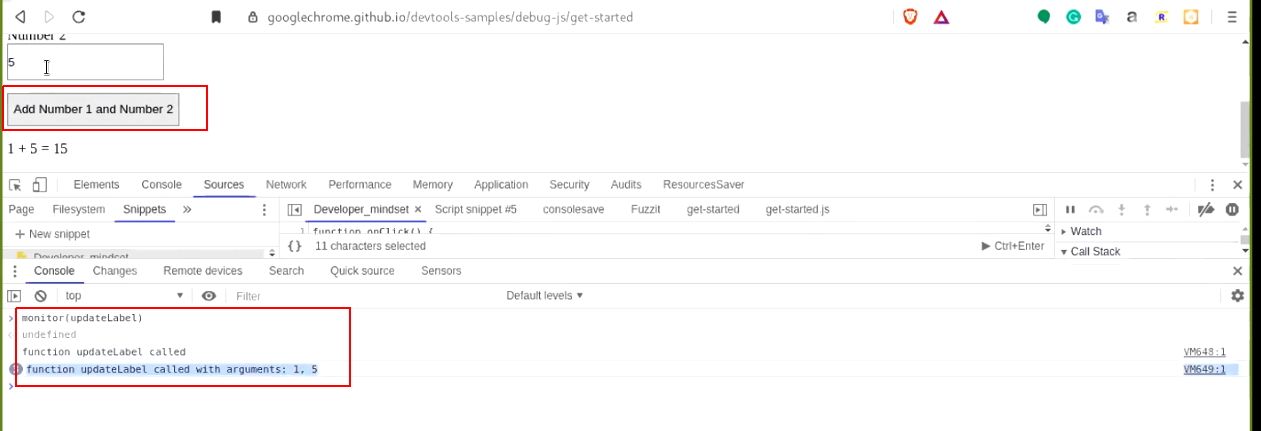
We will use monitor() on our snippet, I am doing this equip you about monitor(). Monitor not just tells you when the method is invoked but current arguments that are passed to it.
It is really helpful because most of the times, the encryption methods are method_name(data,key,salt), if the key is same for all encryption logic, you can obtain the key by monitoring the method.
Steps to use:
For practical purpose, we can take an example of this website: https://googlechrome.github.io/devtools-samples/debug-js/get-started
a.) Once you have executed your snippet code, go back to the console and run - monitor(method_name). Now, when you “click on the add number button again,” the updated updateLabel will gets executed. You will get a notification in console. Observe that the arguments are also in the notification.
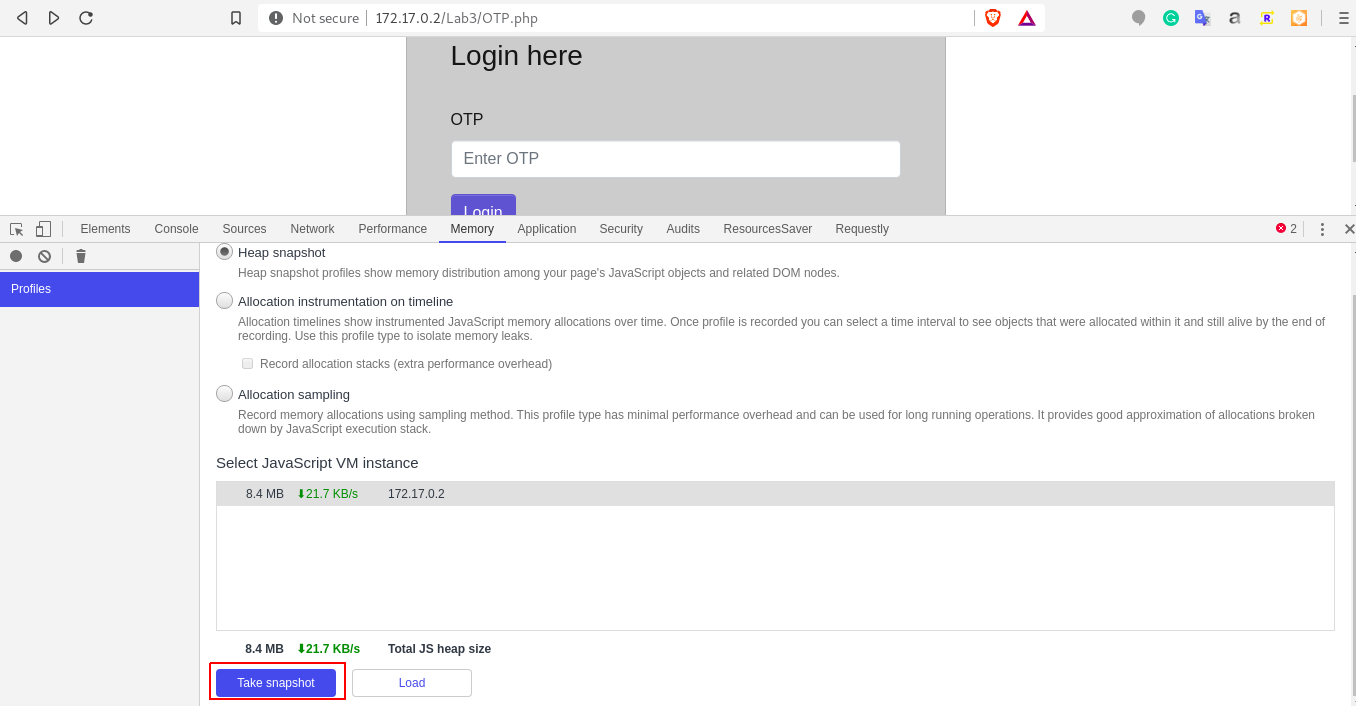
5. Memory:
This feature of devtools will help you to take heap snapshots. You can search the domain content and the sequence of javascipt file that were executed, this feature sometimes make your work easier than following the complex procedure to find the encryption logic or the intended file.
We can search the executed javascript files and filter out the files which may contains the encryption logic.
Steps to use: For practical purpose, we can take an example of the vulnerable lab: http://172.17.0.2/Lab3/login.php
Note: If you have not played with this lab yet, get the docker: here and start playing.
a.) Access the lab. At the OTP.php screen, open the devtools and navigate to memory section. Click on take snapshot.
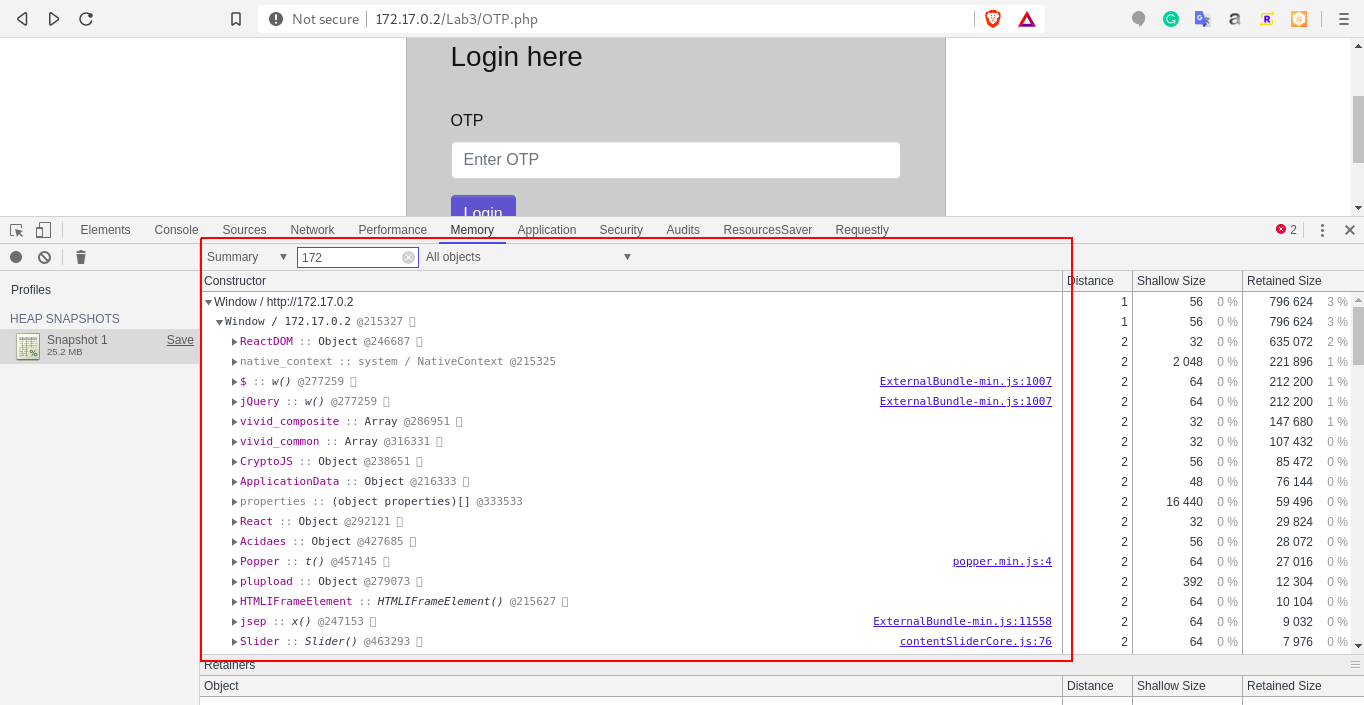
b.) Once the process is completed, search for 172.17 and observe the output.
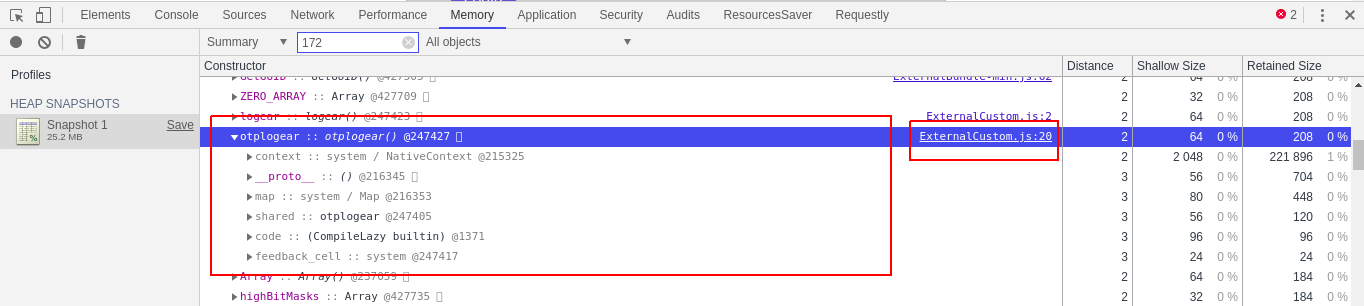
c.) When you scroll down, you will get the method and at the right hand side, the file name as well.
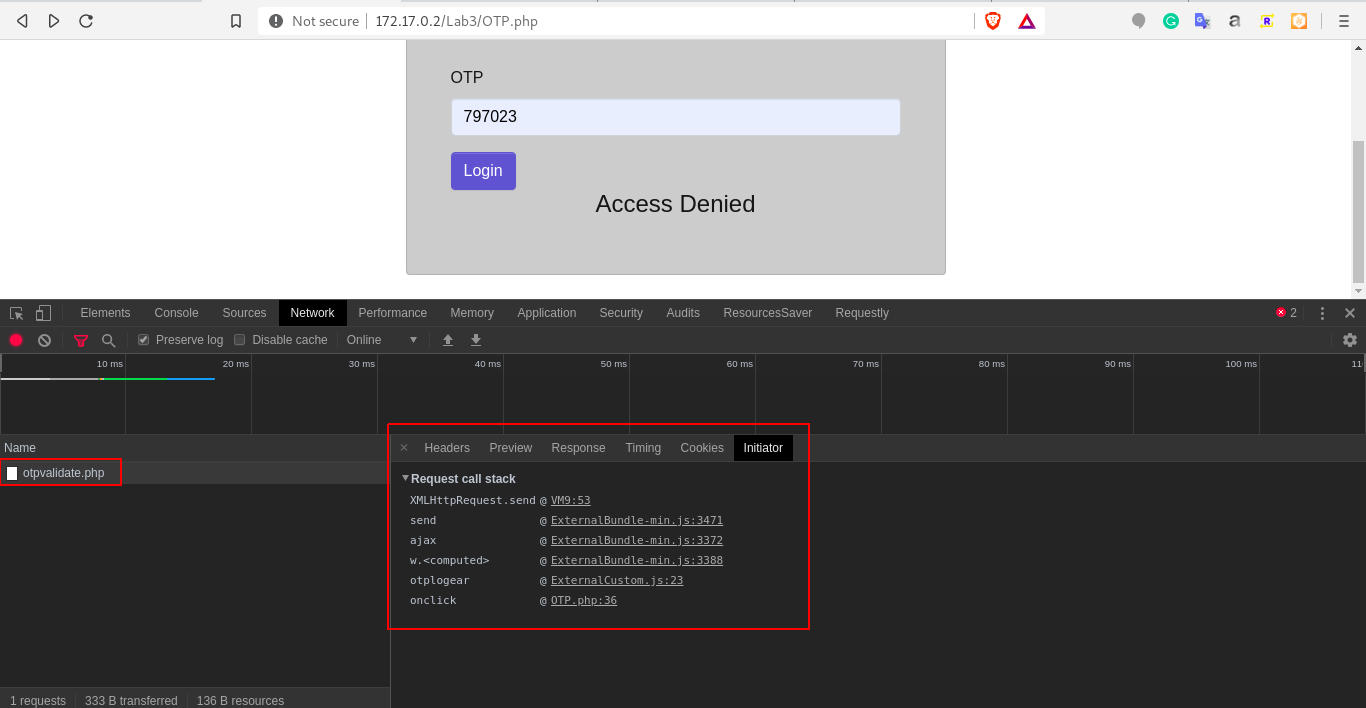
6. Network Initiator:
This is a feature of network section, you can search the method execution sequence in network for each URL. This will help in finding the logic or method in a page-wise manner, i.e. for OTP.php, otp gets encrypted when clicked on the submit button.
Steps to use: For practical purpose, we can take an example of the vulnerable lab: http://172.17.0.2/Lab3/login.php
a.) Access the lab. At the OTP.php screen, open the devtools and navigate to network section. Enter wrong OTP in the application and click on login button. Click on the URL and navigate to “initiator”, observe the otplogear method.
7. Resource Saver:
This is a chrome extension, which helps you to download all the files that are loaded on the client-side. Once the files are downloaded, you can observe them locally through various tools in order to finding logics/links in it.
Steps to use:
a.) Download and install the extension in chrome using link: https://github.com/up209d/ResourcesSaverExt
b.) Navigate to target application. Open the devtools, navigate to “Resource Saver” and click on save all resources.

8. Requestly:
This is a another chrome extension, which helps you to play with source tab workspace. You can replace the application’s javascript code with your custom javascript code by redirecting it to the localhost.
This will help you when multiple changes are required to be performed each time the pages refresh. Because with each refresh, all the changes are gone and you will have to run the snippet code again.
Steps to use:
For practical purpose, we can take an example of the vulnerable lab: http://172.17.0.2/Lab3/login.php
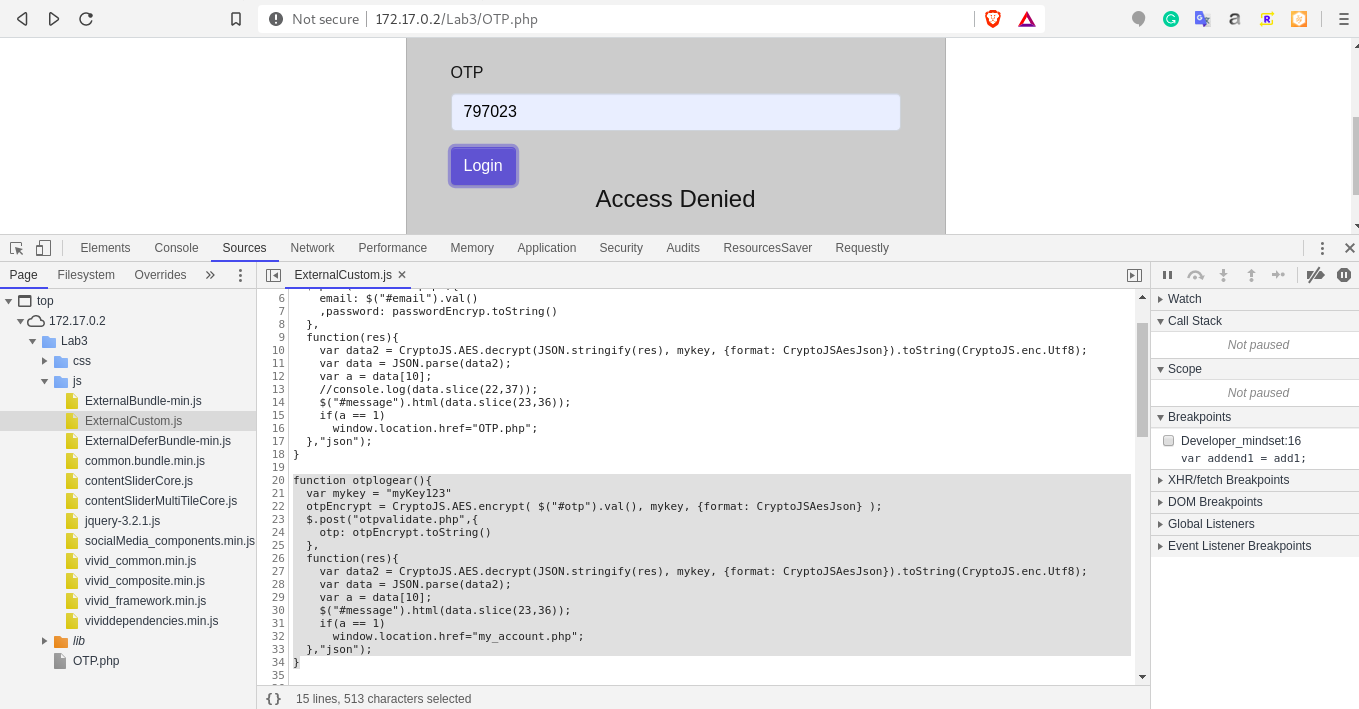
a.) Access the lab. At OTP.php screen, open up the devtools and observe otplogear method in file ExternalCustom.js*. Observe the condition “a == 1” in the code.
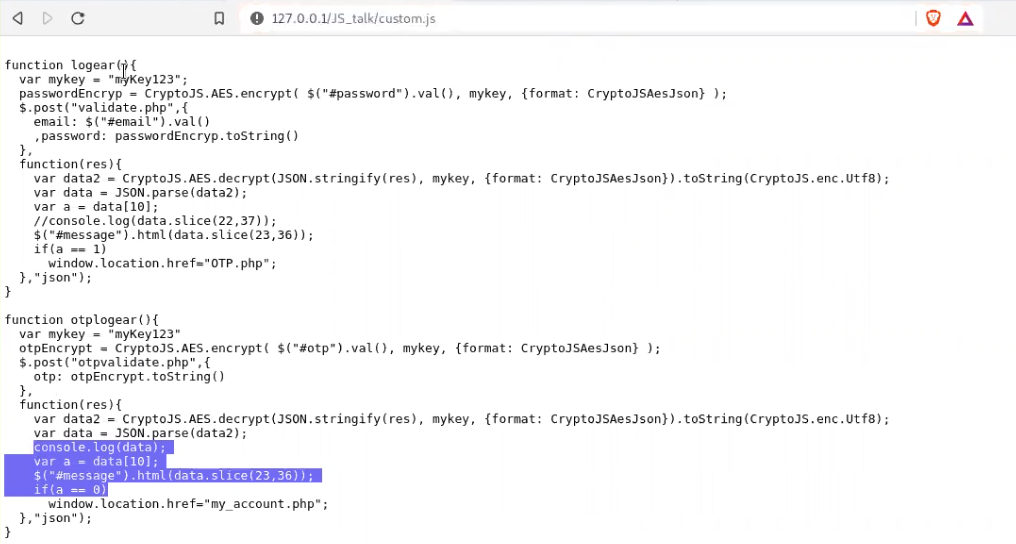
b.) Create a custom.js file with the changed condition “a == 0” in the code. Which means that even if we enter the wrong OTP, application will redirect us to the dashboard page.
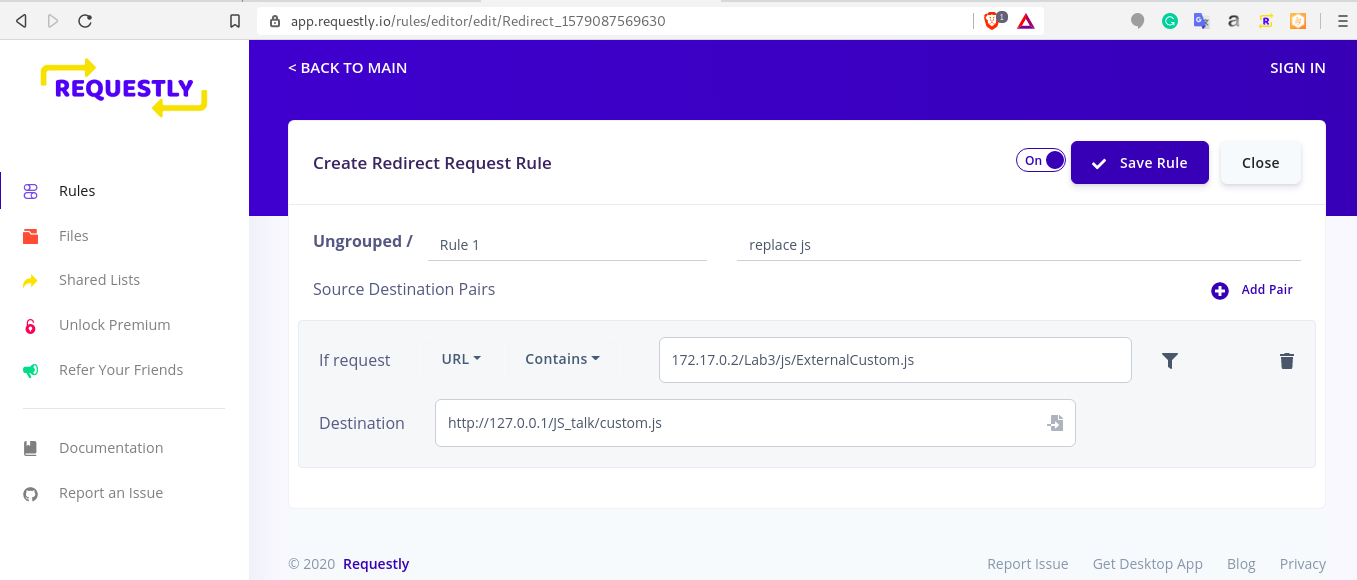
c.) Install the requestly extension from chrome extension store Create the rule shown below. Here, we are redirecting the http://172.17.0.2/Lab3/js/ExternalCustom.js to http://127.0.0.1/JS_TALK/custom.js
d.) Reload the application and observe in devtools, one more workspace is added in the source tab with 127.0.0.1. The original ExternalCustom.js is automatically removed.
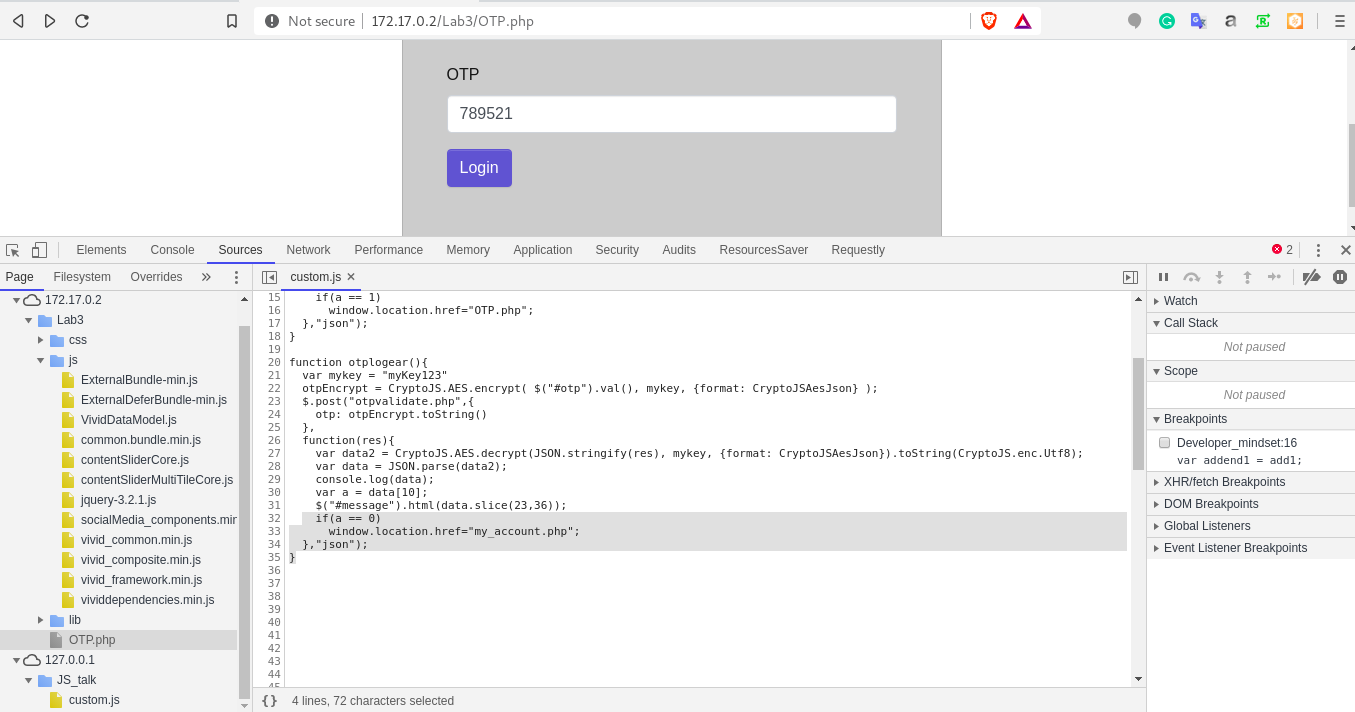
e.) Now whenever you click on Login with the wrong otp, Boom!! you are logged into the application :))
Conclusion:
This blog was to help make the debugging process easier to find the encryption logic using devtools. The real world of encryption sure is a lot more complicated than this one. Loaded with tools and use of their power gives you an upperhand.:))
There is a lot more that you can do with chrome devtools. Do check out: https://medium.com/frontmen/art-of-debugging-with-chrome-devtools-ab7b5fd8e0b4
I enjoyed writing this article and hope that you enjoyed reading it too.
In part 3, we shall move on to more sophisticated ways, creating our own snippets to fuzz the encrypted parameters using devtools.
Thank you for your time and stay tuned for more!
If there is anything I have missed, or you would like to add, please do let me know. :))
You can find me here:
Twitter : @sameer_bhatt5
Github : bhattsameer
LinkedIn: bhatt-sameer
![]()
Reference:
https://blittle.github.io/chrome-dev-tools/
https://javascript.info
https://developers.google.com/web/tools/chrome-devtools
https://medium.com/frontmen/art-of-debugging-with-chrome-devtools-ab7b5fd8e0b4
![]()